A focused home for the chart
Choose Explore charts beside the estimate, or use the product menu, to open the new Explore scenario page. The advanced chart lives there. A stock-price-only chart and slider also remain below Details & assumptions on the main page, alongside contract setup and the estimate. Back to scenario returns you to that workflow with your current inputs.
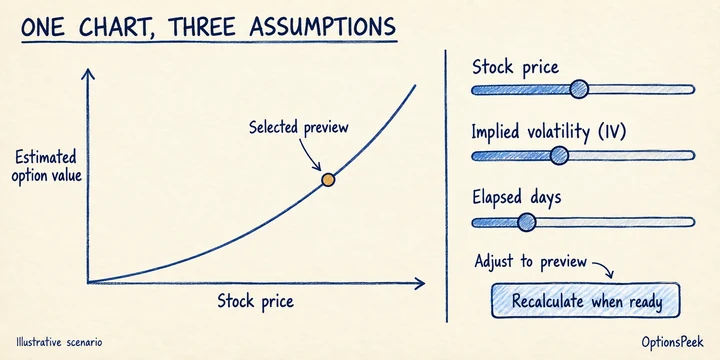
The new view brings stock price, implied volatility, and elapsed days together around one chart. Stock price selects a point on the curve; the IV and time assumptions change the scenario used to build it. These are three controls for the same chart.
Move quickly, or enter an exact value
Use the sliders to explore nearby assumptions, or type a precise stock price, target IV, or number of days. IV can remain held constant or change to a target value. The time control follows the contract expiration, and At expiration selects the supported remaining horizon.
Try changing one assumption at a time to see how the preview responds. Fractional days and exact numeric entries remain available when a broad slider movement is too coarse for the question you want to examine.
Preview first, recalculate when ready
The chart preview updates as you change the controls. Recalculate submits the current assumptions for a new estimate. The page distinguishes the live preview from the last submitted result so you can tell when your edits need recalculation.
Moving a slider does not fetch new market data, submit an estimate request, or save your work. The preview uses the inputs already in the scenario. Both the preview and submitted estimate are conditional estimates; actual option prices can differ.
Save or share the view you explored
The exploration page has a direct Save action and the existing saved-scenarios menu. After loading and editing the same contract, Save updates that record. Returning to the calculator or Profit / Loss keeps the working scenario connected.
Share chart on desktop, or Share on mobile, creates a PNG of the current chart and preview context with the OptionsPeek logo and wordmark. It includes the selected stock move, estimated option value, IV, and time assumptions. Supported devices open their share sheet; other browsers download the image.