What changed
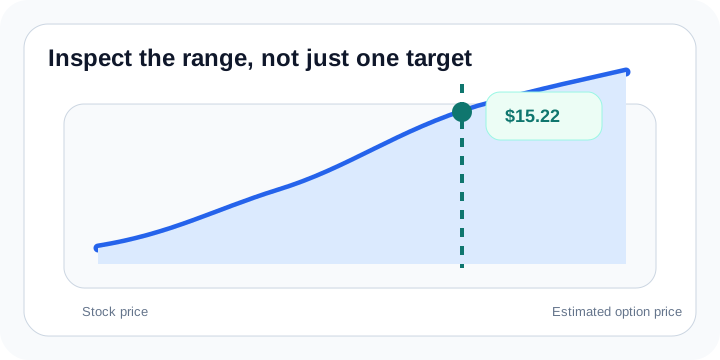
OptionsPeek now includes a stock price chart that plots estimated option value across nearby stock prices. Instead of stopping at one target move, you can inspect how the same contract may respond if the stock lands above, below, or near your original target.
The chart uses the same scenario assumptions as the estimate, so it stays connected to the contract, base price, stock move, Greeks, IV assumptions, and time horizon already on the page.
Why it helps
Most real trading plans are not built around one perfect stock price. The chart helps turn the estimate into a range, which is useful when you are thinking about limit orders, target prices, and how much room the scenario has to work.
You can use the selected chart point as a planning check, then compare it with the Estimate Summary, Greeks Breakdown, and Profit / Breakeven view before deciding whether the scenario still makes sense.